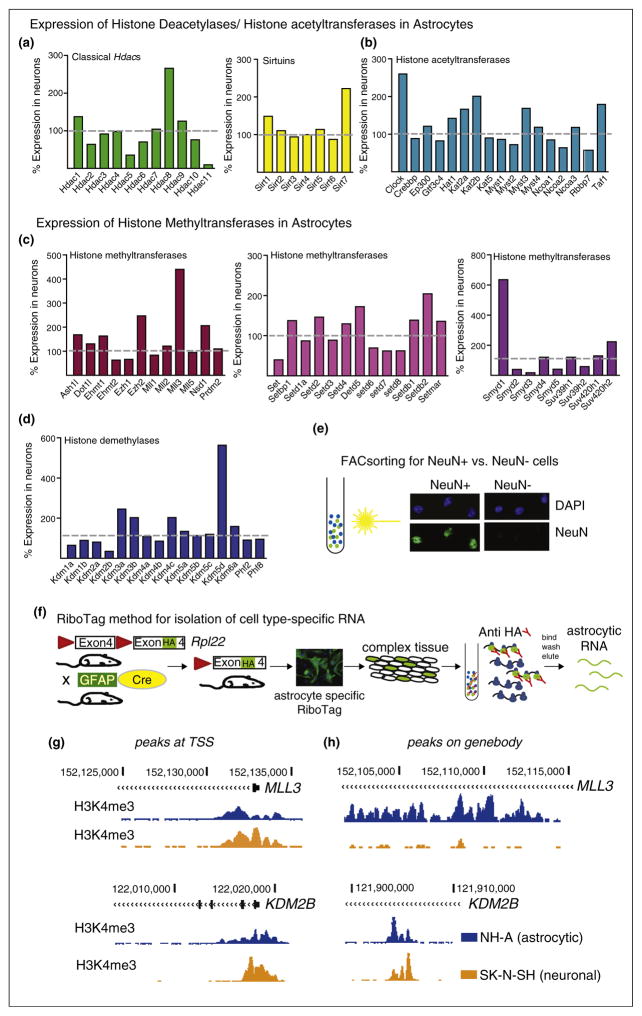
Figure 1.
Epigenetics and astrocytes, rationale and methodological approach. (a)–(d) Expression levels of histone-modifying enzymes in astrocytes presented relative to neuronal expression levels. Data is derived from a RNAseq dataset using isolated neuronal and astrocytic RNA from mouse forebrain. Different cell types were isolated either by using EGFP reporter mice in conjunction with flow cytometry or by binding to panning plates [37]. Similarly, purified nuclei from specific cell types can be obtained from isolation of nuclei (transgenically) tagged in specific cell types (INTACT) using antibody coated magnetic beads [39]. These sorting methods can be used for cell type specific RNAseq and ChIPseq approaches. (a) Expression levels of deacetylases (HDACs and Sirtuins) and (b) histone acetyltransferases (HATs) and (c) histone methyl-transferases and (d) histone demethylases. (e,f) Alternative methods well suited for cell type specific ChIPseq [38,39] and RNAseq [40], respectively, are (e) fluorescence activated cellsorting (FACsorting) or (f) the use of RiboTag mice. (e) Photomicrographs show positive selection of neuronal (NeuN+) versus non-neuronal (NeuN−) cells from mouse brain after FACS. Nuclei were counterstained with DAPI. Note absence of NeuN staining in NeuN− fraction. (f) Cartoon-like representation of the RiboTag model/technology for isolation of cell type-specific RNA from mouse brain. This approach is utilizing the Cre/loxP system to tag ribosomes (ribosomal protein RPL22) in specific cell populations with an HA, for example, by using the astrocyte specific GFAP promoter, expression of Cre and therefore activation of the HA tag will occur in astrocytes only. Subsequently, HA tagged ribosomes can be immunoprecipitated and the enclosed RNA purified. (g,h) Cell type specific gene expression profiles and histone landscapes in human neural cells can be studied in post mortem brain using FACS [38,39] or using differentiated iPSCs or neuronal or astrocytic cell lines. UCSC genome browser tracks to visualize sequencing tracks from ChIPseq for the active histone mark H3K4me3 (Histone 3 lysine 4 trimethylation) on NH-A (astrocytic, blue) and SK-N-SH (neuronal, orange) cells. (g) Peaks at the transcription start site (TSS, left panels) and on the (h) gene body (right panels) on the MLL3 (higher expression levels in astrocytes) and the KDM2B (lower expression levels in astrocytes) genes.

