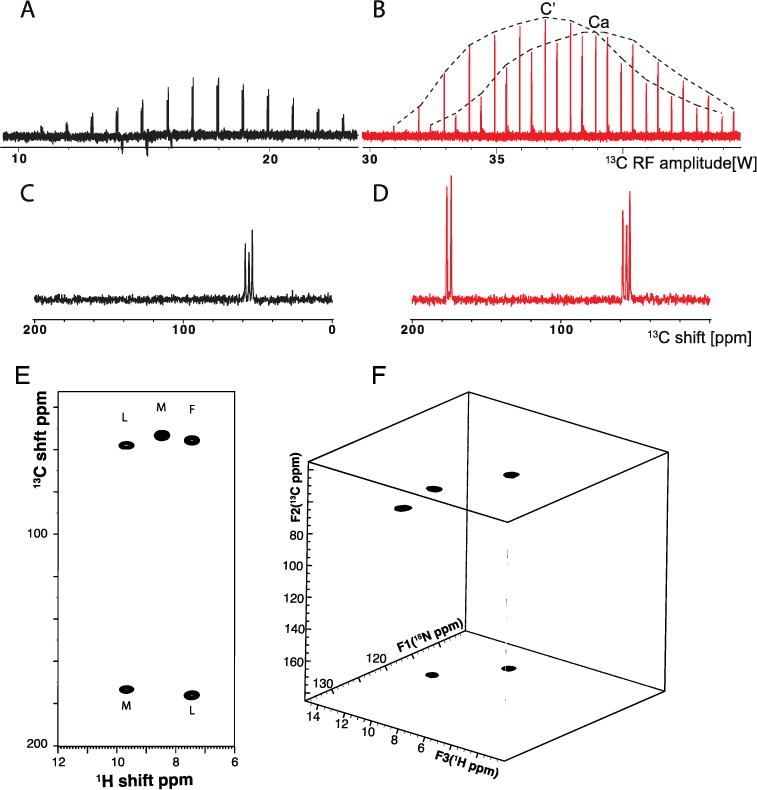
Figure 3.

13C- and 1H- detected spectra of MLF acquired with 60 kHz MAS. A. Variable amplitude 13C spectra of SPECIFIC-CP between 15N and 13Cα at fixed 25 kHz 15N amplitude. 13C and 15N are irradiated at 55 ppm and 120 ppm respectively. B. Same as A, but 13C irradiated at 115 ppm and 15N amplitude at 15 kHz (2.8 watts). Envelopes on top are drawn to visually guide the magnetization transfer to 13Cα and 13C′. C. Optimal 1D spectra obtained from A. D. Same as C, but for 13C amplitude at 38 watts. E. 15N-edited and 1H-detected 1HN/13C two-dimensional correlation spectrum. F. 1H-detected 13C/15N/1HN three-dimensional correlation spectrum. Both A. and B. were obtained with 16 scans, and 4 second recycle delays. The three-dimensional spectrum was reconstructed from 10% sampling density of a 400 (t2)/64 (t1) complex data matrix. The sampling schedule was generated in TOPSPIN 3.2 by incorporating T2 and J coupling values for 13C nuclei. The spectrum was reconstructed using the compressed sensing package in TOPSPIN.
