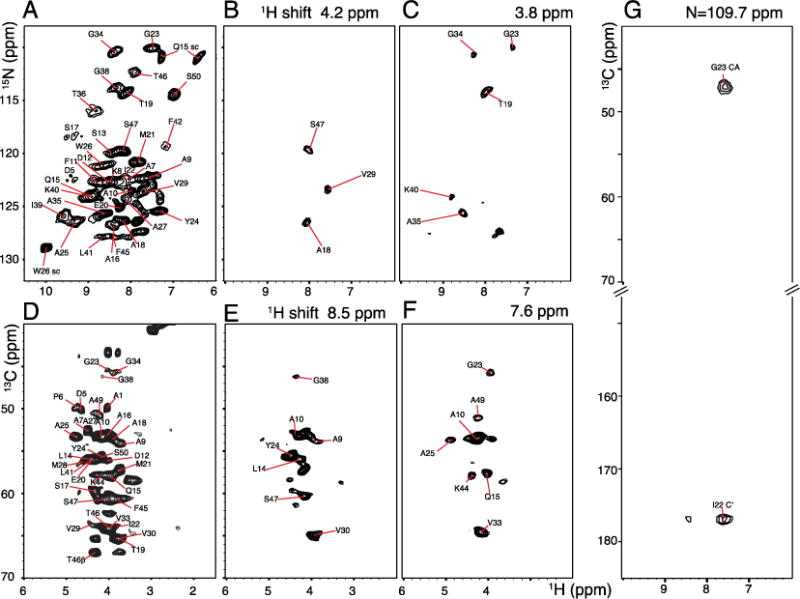
Figure 4.

Two- and three-dimensional spectra of uniformly 13C and 15N labeled fd coat protein in bacteriophage particles obtained with 60 kHz MAS. A. Two-dimensional 1H/15N heteronuclear correlation spectrum. B. and C. 1H/15N two-dimensional slices obtained at 4.2 and 3.8 ppm 1H chemical shifts, respectively. D. Two-dimensional 1H/13C heteronuclear correlation spectrum. E. and F. Two-dimensional slices obtained at 8.5 and 7.6 ppm 1H chemical shifts. A. and D. were obtained using the pulse sequence shown in Figure 1B without incorporating DCP editing pulses. Three-dimensional experiments were carried out using the pulse scheme shown in Figure 1B with a total number of 16 scans, 4 s recycle delay; total evolution periods of 10 ms (t3) 1H; 3 ms (t2) 1H; 7.2 ms (t1) 15N, and 3.6 ms (t1′) 13C. Equal numbers of data points were linear predicted during data processing.
