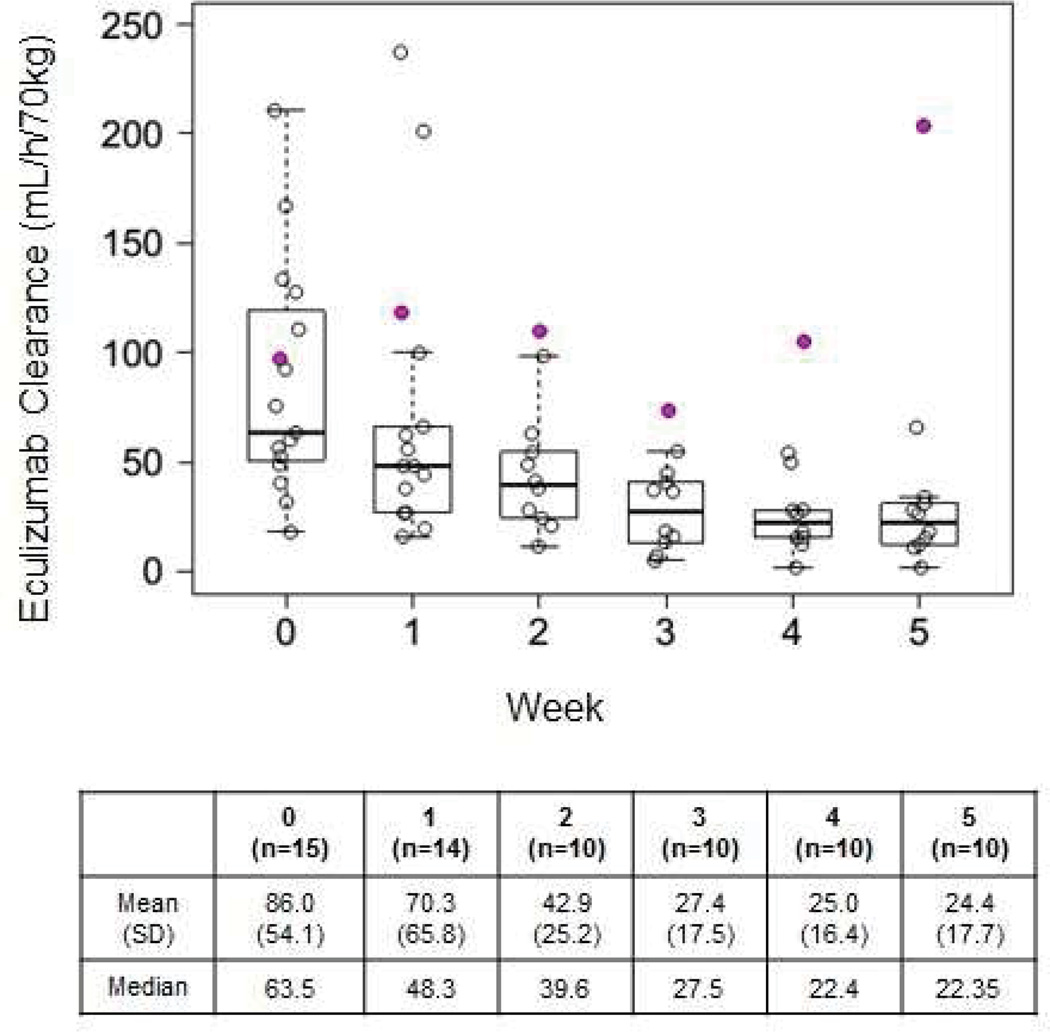
Figure 2. Eculizumab clearance during the first five weeks of therapy.
This figure illustrates eculizumab clearance during first five weeks of therapy. Open circles show individual clearance values standardized by body actual body weight using allometric scaling. Individual clearance estimates were plotted weekly using the pharmacokinetic analysis. Box plot shows 25th, 50th and 75th percentiles with range. Eculizumab clearance is highest at the start of the therapy and declines by week five to become nearly equal to the eculizumab clearance reported during maintenance therapy in patients in aHUS or PHN. Shaded red circles represent the clearance trajectory in a patient with severe gastrointestinal bleeding. These clearances were excluded from summary statistics and are displayed here to illustrate high drug clearance in a patient with clinically significant blood loss and high blood product support.

