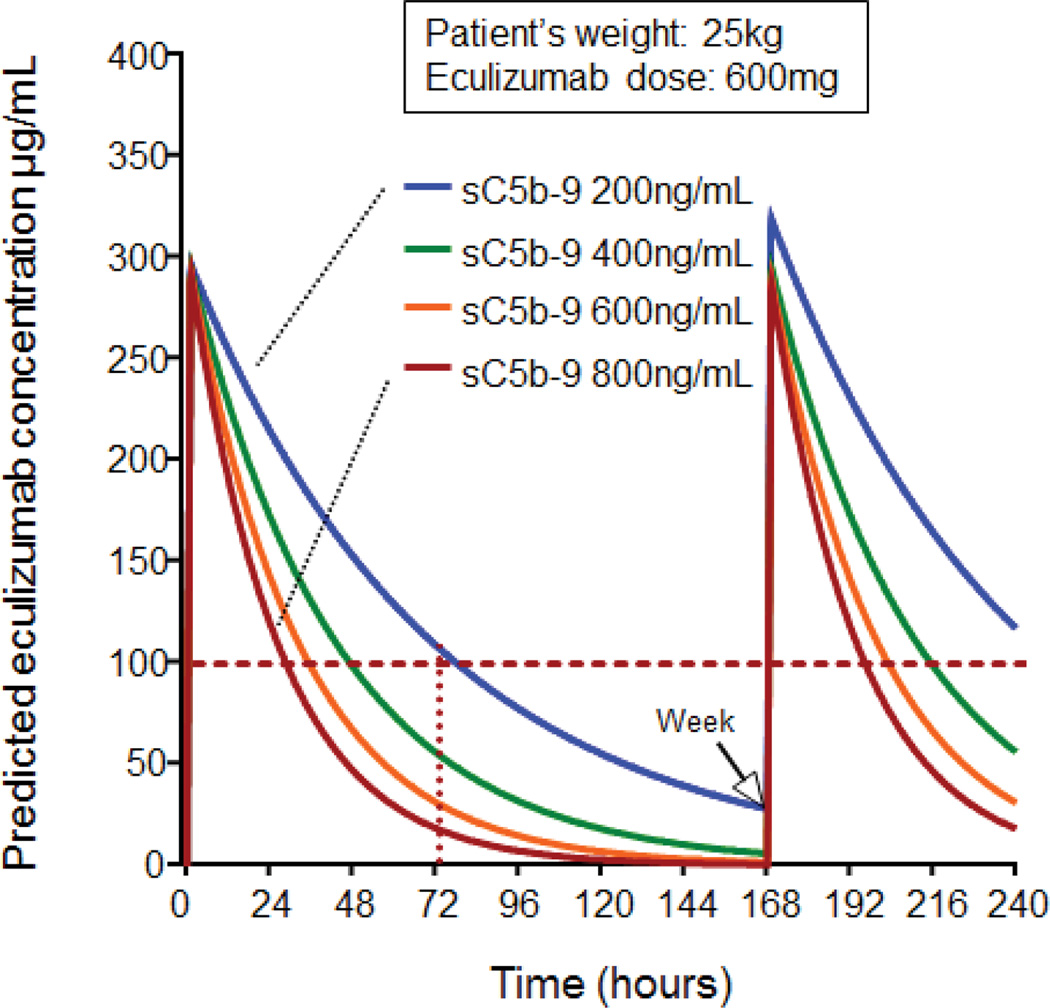
Figure 3. Pre-treatment plasma sC5b-9 concentration predicts eculizumab clearance.
This figure displays representative case of eculizumab serum concentrations-time profiles simulated with mean population estimates (Table 2) for 25 kg HSCT recipient receiving the eculizumab induction dose of 600 mg every 7 days as currently recommended for the same weight patient with aHUS. The y-axis shows predicted eculizumab serum concentration. The x-axis shows time in hours from the first eculizumab dose administered (hour 0) to the second dose given in one week (hour 168). The horizontal dotted red line marks the suggested therapeutic eculizumab target above >99 µg/mL required for complement blockade. Eculizumab serum concentration-time clearance curves are marked in different colors representing different plasma sC5b-9 concentration (from 200 to 800 ng/mL) at the start of eculizumab therapy (normal plasma sC5b-9 concentration is 74–244 ng/mL). Eculizumab elimination rate increases along with increasing plasma sC5b-9 concentration. This algorithm using patient’s actual weight, initial eculizumab dose (mg) and plasma sC5b-9 concentration value at the start of therapy allows prediction of the time when eculizumab serum concentration declines below required therapeutic level and when next medication dose should be given to sustain complement blockade.

