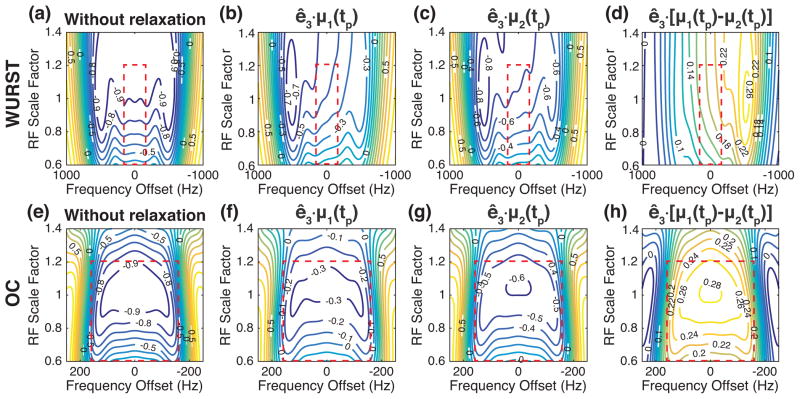
Figure 2.
The z components of the magnetization vectors as a function of the frequency offset and the RF scale factor, at the end of the WURST and OC pulses applied to the thermal equilibrium state. (a–c) The contour plots of the z components after applying the WURST pulse for the system without relaxation (a) and with T1 = T2 = 20 ms (b) and 38 ms (c). (d) The difference between the contour plots shown in (b) and (c). (e–g) The contour plots of the z components after applying the OC pulse for the system without relaxation (e) and with T1 = T2 = 20 ms (f) and 38 ms (g). (h) The difference between the contour plots shown in (f) and (g). The red box indicates the range of the frequency offsets and RF scale factors included in the numerical optimization.

