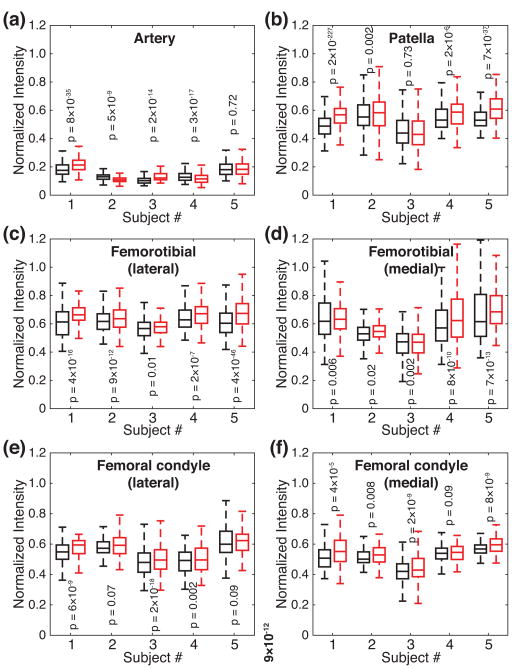
Figure 4.
Box plots of the signal intensities from the fluid-suppressed 23Na MRI’s performed with the WURST (black boxes) and OC (red boxes) pulses, after normalized to the signal intensities from 23Na MRI performed without fluid suppression. (a) Artery. (b) Patellar cartilage. (c) Femorotibial cartilage, lateral. (d) Femorotibial cartilage, medial. (e) Cartilage on femoral condyle, lateral. (f) Cartilage on femoral condyle, medial. For each pair of the distributions, the p value from paired samples t-test is displayed.

