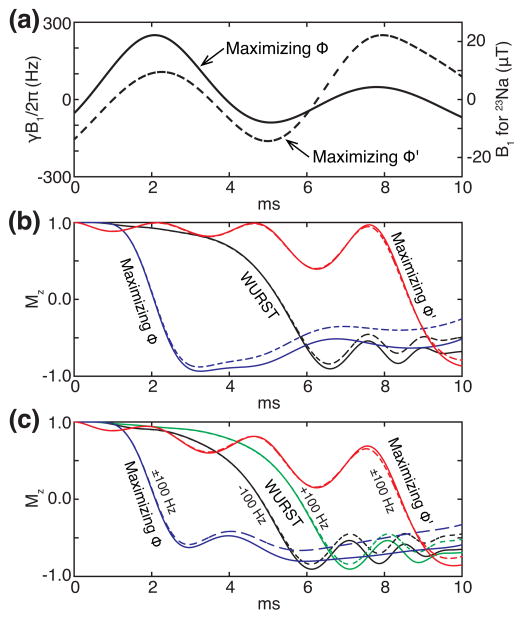
Figure 7.
Dependence of OC pulses and their performances on cost functions. (a) The x components of the OC pulses maximizing the cost functions ϕ (solid) and ϕ′ (dash). The y components are null. (b) The evolutions of the z components of the magnetization vectors on resonance while applying the WURST pulse (black lines) and the OC pulses maximizing the cost functions ϕ (blue lines) and ϕ′ (red lines). (c) The evolutions of the z components of the magnetization vectors at ±100 Hz while applying the WURST pulse (black and green lines) and the OC pulses maximizing the cost functions ϕ (blue lines) and ϕ′ (red lines). For the OC pulses, the trajectories for −100 Hz and +100 Hz coincide. The straight and dashed lines respectively represent the systems with the relaxation times 38 ms and 20 ms.

