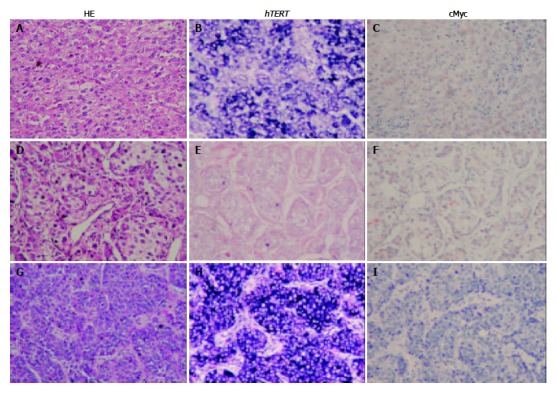
Figure 1.

Corresponding distribution of hTERT signals and c-Myc staining in HCC tissue detected by HE staining (A, D, and G); in situ hybridization (hTERT positive, B and H; hTERT negative, E); and immunohistochemistry (c-Myc positive, C and F; c-Myc negative, I).
