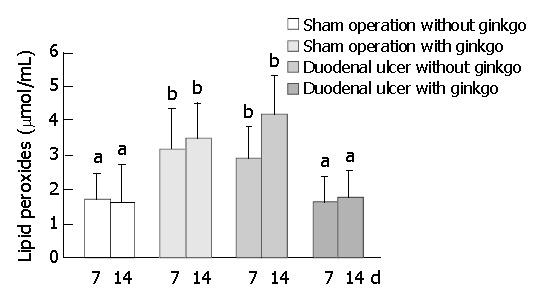
Figure 6.

Concentration of lipid peroxides (malondialdehyde and 4-hydroxy-2(E)-nonenal) in plasma of the rats during experimental period. Data are mean ± SD (n = 8). Values not shar-ing the same letter differ significantly (P < 0.05) within the same day by Fisher’s least significant difference test.
