Figure 4.

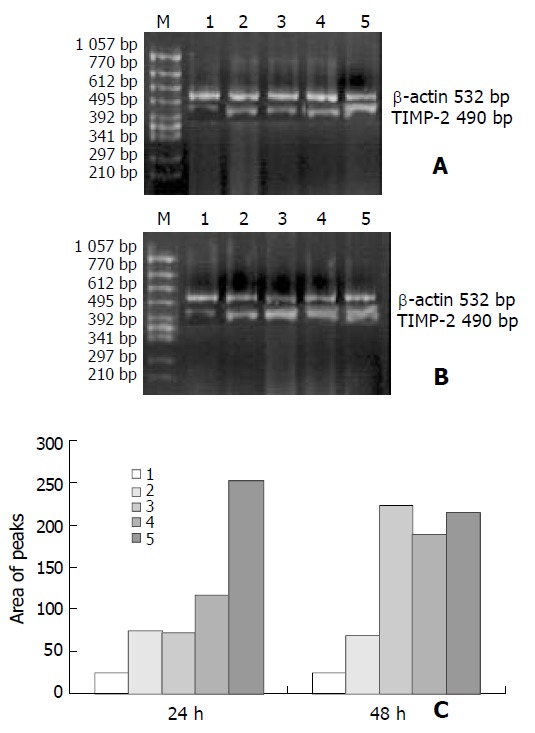
RT-PCR results showing expression of TIMP-2 mRNA in SGC-7901 cells treated by β-ionone for 24 h (A) and 48 h (B). C: chart of area of peaks; Lanes 1-5: 0, 25, 50, 100 and 200 μmol/L of β-ionone; M: molecular weight markers.

RT-PCR results showing expression of TIMP-2 mRNA in SGC-7901 cells treated by β-ionone for 24 h (A) and 48 h (B). C: chart of area of peaks; Lanes 1-5: 0, 25, 50, 100 and 200 μmol/L of β-ionone; M: molecular weight markers.