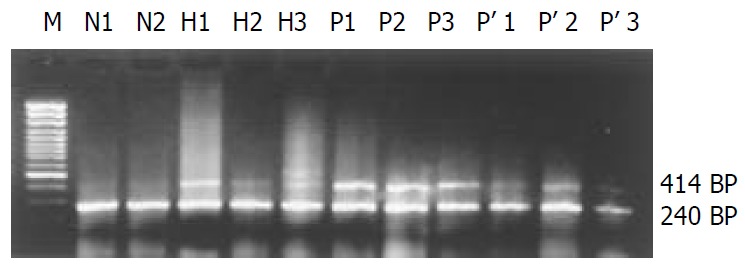
Figure 1.

Representative RT-PCR results of 4-1BB mRNA ex-pression in normal liver, and HCC tissues as well as its adja-cent tissues. (M, GeneRulerTM 100 bp DNA Ladder Plus; N, normal liver; H, HCC tissues; P, adjacent tissues to HCC (<1 cm), P’: liver tissues located within 1 to 5 cm away from tumor edge)
