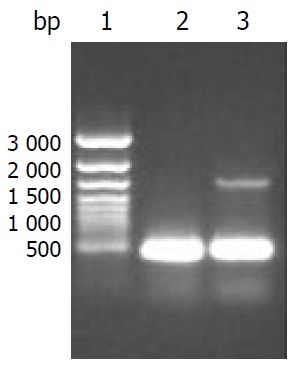
Figure 2.

Identification of CYP2D6 mRNA expression in HepG2-CYP2D6 and HepG2 cells by RT-PCR with beta-actin as internal control. Lane 1: 1 kb ladder marker, 2: RT-PCR prod-ucts of HepG2 cells showing a 462 bp of beta-actin, 3: RT-PCR products of HepG2-CYP2D6 cells showing a 462 bp of beta-actin and 1.5 kb of CYP2D6.
