
Figure 3.
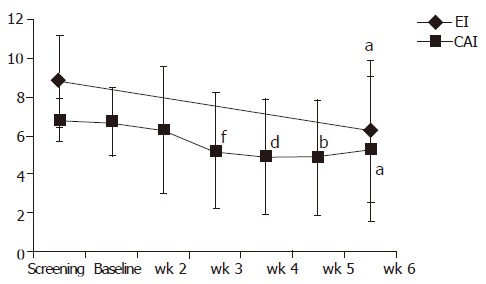
Course of clinical and endoscopic activity indices (CAI, EI) throughout the apheresis treatment. aP<0.05 vs Et at wk 6, bP<0.01 vs Et at wk 5, dP<0.01 vs Et at wk 4, fP<0.05 vs Et at wk 3.
Official websites use .gov
A
.gov website belongs to an official
government organization in the United States.
Secure .gov websites use HTTPS
A lock (
) or https:// means you've safely
connected to the .gov website. Share sensitive
information only on official, secure websites.
Course of clinical and endoscopic activity indices (CAI, EI) throughout the apheresis treatment. aP<0.05 vs Et at wk 6, bP<0.01 vs Et at wk 5, dP<0.01 vs Et at wk 4, fP<0.05 vs Et at wk 3.