
Figure 1.
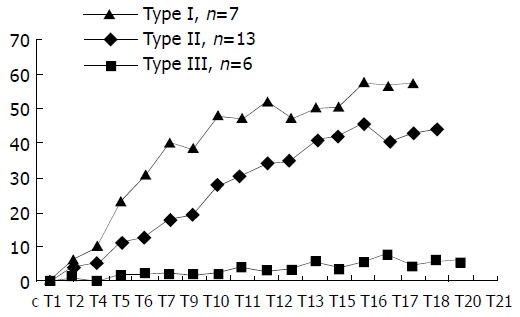
Three patterns (I, II, III) of time-density curve ob-served in HCC patients. The transverse axis represents the time and the Y-axis represents the peak enhancement value in Hounsfield units.
Official websites use .gov
A
.gov website belongs to an official
government organization in the United States.
Secure .gov websites use HTTPS
A lock (
) or https:// means you've safely
connected to the .gov website. Share sensitive
information only on official, secure websites.
Three patterns (I, II, III) of time-density curve ob-served in HCC patients. The transverse axis represents the time and the Y-axis represents the peak enhancement value in Hounsfield units.