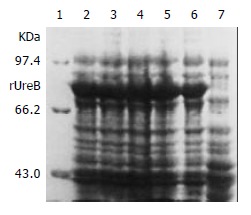
Figure 4.

Expression of rUreB induced by IPTG at different concentrations. Lane 1, molecular mass marker; lanes 2-4, IPTG at 1.0, 0.5, and 0.1 mmol/L, respectively; lanes 5 and 6, bacterial precipitate and supernatant with IPTG at 1 mmol/L , respectively; lane 7, control.
