Fig. 2.

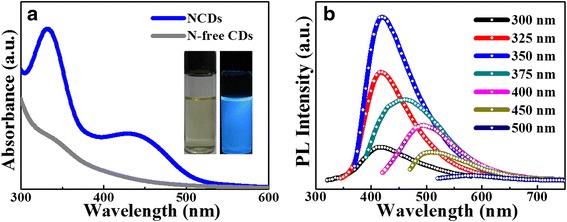
a UV–vis spectra of NCDs and N-free CDs. Insets are the photographs of NCDs aqueous solution under day light (left) and UV lamp irradiation (right). b PL spectrum of NCDs with excitation of different wavelengths recorded from 300 to 500 nm

a UV–vis spectra of NCDs and N-free CDs. Insets are the photographs of NCDs aqueous solution under day light (left) and UV lamp irradiation (right). b PL spectrum of NCDs with excitation of different wavelengths recorded from 300 to 500 nm