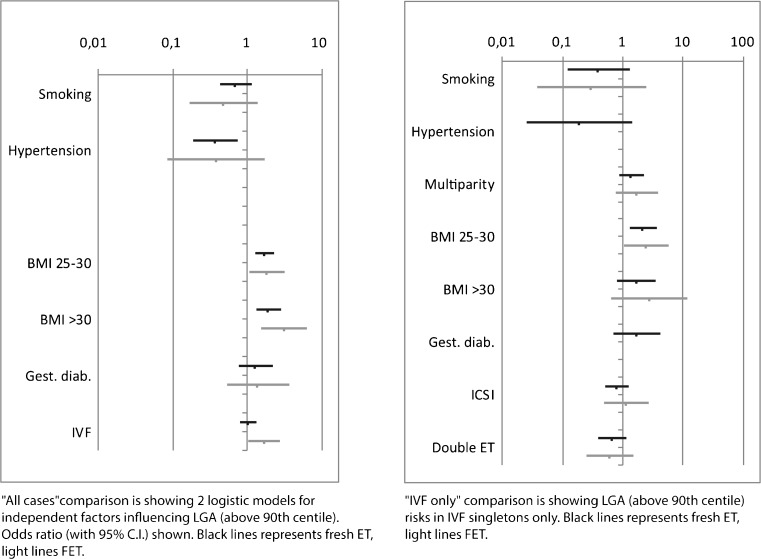
Fig. 1.
Graph “All cases” shows a comparison of two logistic models for independent factors effecting LGA (above 90th centile) odds ratio (with 95 % C.I) light line shows FET with controls, black line shows fresh ET with controls. Graph “IVF only” is showing LGA (above 90th centile) risks in IVF singletons only, following FET (light line) or fresh ET (black line)

