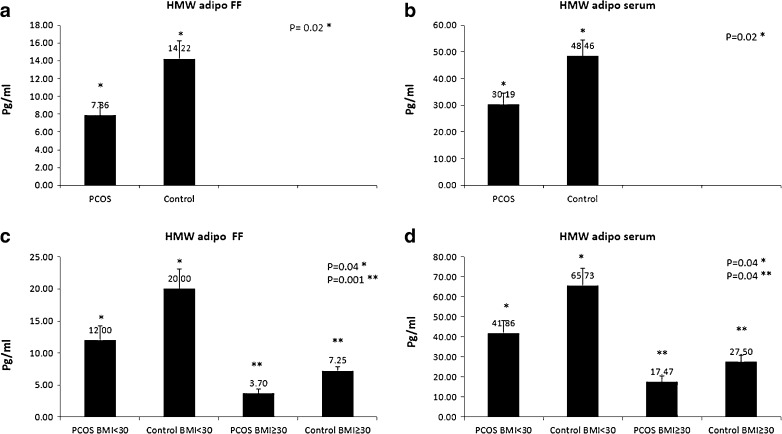
Fig. 3.
HMW adiponectin protein concentration in the follicular fluid (FF) and in the serum of PCOS and control groups evaluated by ELISA method. a, b FF and serum HMW adiponectin levels of PCOS patients were significantly lower than that of controls (p = 0.02). c Comparison of HMW adiponectin levels in FF of control and PCOS groups with BMI <30 (p = 0.04) and in those with BMI ≥30 (p = 0.001). d Comparison of serum HMW adiponectin levels between control and PCOS groups with BMI <30 (p = 0.04) and in those with BMI ≥30 (p = 0.04). Data were analyzed by Student’s t test and one-way ANOVA with Tukey’s multiple comparison tests

