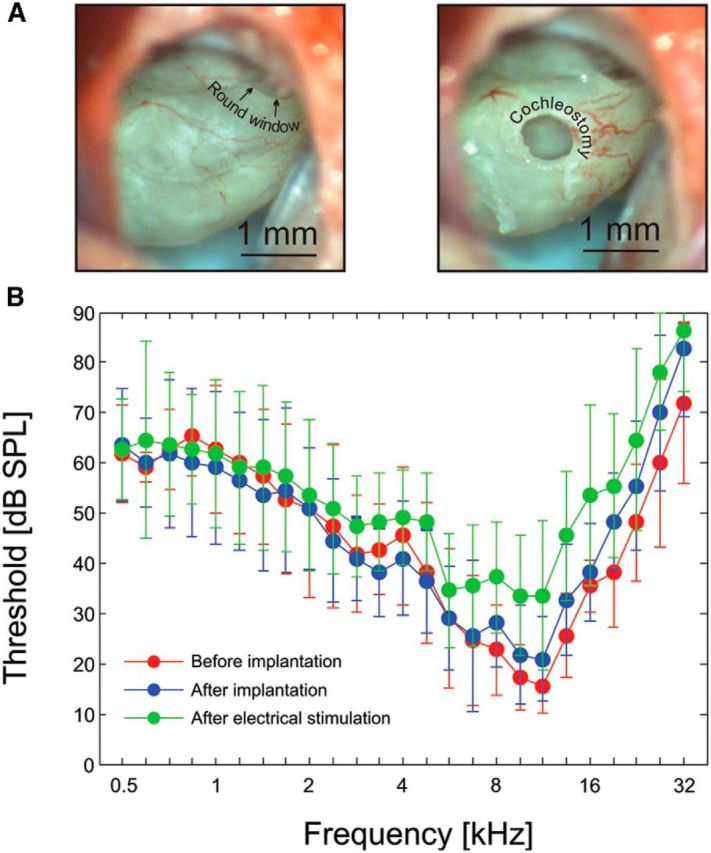
Figure 2.

Cochlear implantation in the guinea pig. A, Left, Round window niche and the view of the cochlea through the cochleostomy. Right, Position of the cochleostomy. B, Hearing thresholds defined as the lowest threshold determined at each tested frequency by the multielectrode array placed in the inferior colliculus. The data shown are means ± SD from all animals (n = 11). Red, Thresholds before implantation. Blue, Thresholds after implantation. Green, Thresholds after electrical stimulation (before pharmacological deafening).
