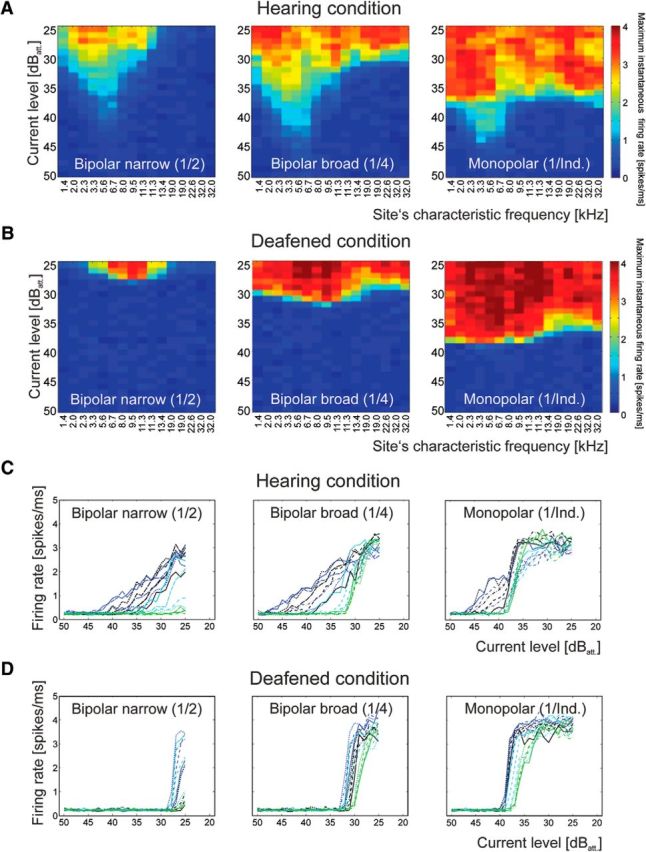
Figure 4.

Effect of the spread of the electrical field, biphasic pulse (100 μs/phase). A, Example of excitation profiles for one hearing animal. The site's CF with lowest threshold (5.6 kHz) remained unaffected by the increase in spread of the electrical field. B, Data from the same animal after deafening. The low-threshold peak disappeared. C, Rate–level functions for the data in A. The site‘s CF is designated by color, starting with black (lowest CFs), blue (mid CFs) and green (high CFs). Sites with low CF show shallow rate–level functions. D, After deafening, shallow rate–level functions disappeared and thresholds increased. 40 dBatt correspond to 100 μApp.
