Figure 6.
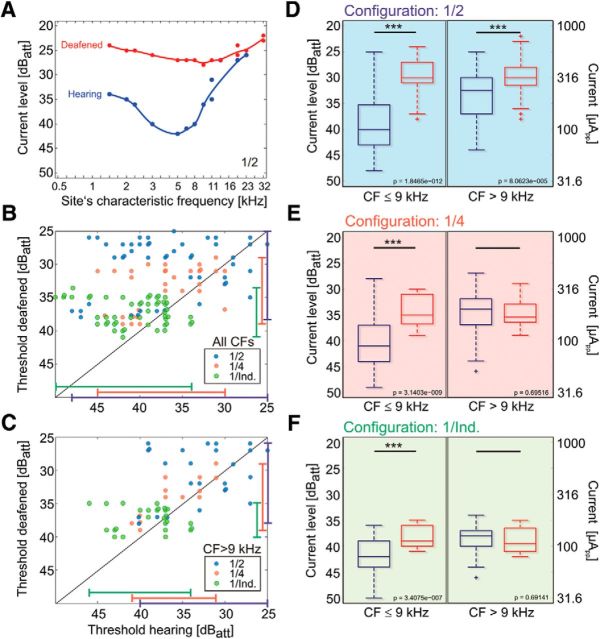
Effects of deafening on thresholds, biphasic pulse (100 μs/phase). A, Individual recording for narrow bipolar (1/2) configuration. In this example, lowest threshold is also observed for the hearing condition near 5 kHz. After deafening, the lowest threshold is at the site with previous CF between 9 and 10 kHz. B, Data from recordings where pairwise comparisons could be performed (details in the text). The range of thresholds was consistently higher for the hearing condition and largest for bipolar configuration (marked by the lines at the border of the panel). Data spread above the diagonal. C, The part of the data for sites with high CFs. Here, data points are clustered around the diagonal, indicating that deafening did not systematically change the thresholds and the loss in thresholds is predominantly due to the sites with low CFs. D, All data pooled from 11 animals for narrow bipolar configuration. Deafening leads to loss of thresholds both in the apical and basal cochlea. E, For broad bipolar configuration, the loss of thresholds is observed only in the apical cochlea. F, For monopolar configuration, loss of threshold with deafening is observed only in apical cochlea. 40 dBatt correspond to 100 μApp. Two-tailed Wilcoxon-Mann–Whitney test, *∼5% significance level; **∼1% significance level; ***∼0.1% significance level.

