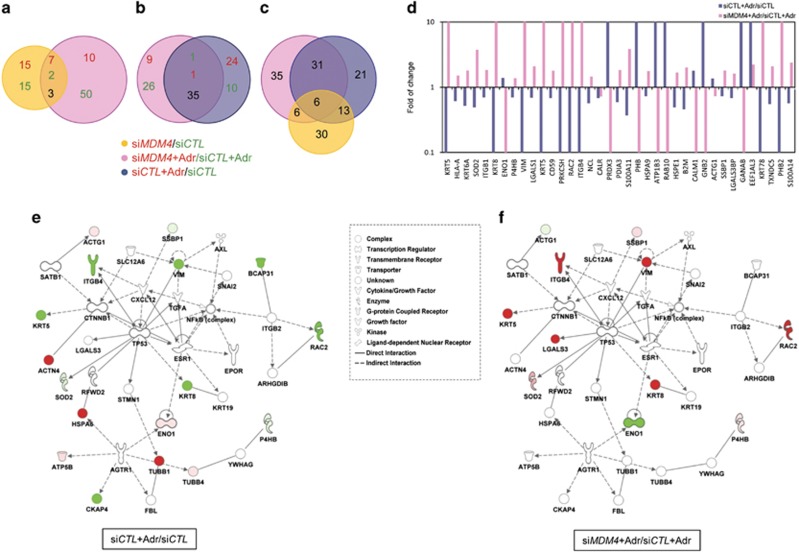
Figure 5.
Shotgun proteomic and bioinformatic analysis of MCF10A cells. (a) Overlap of proteins resulting from comparison of siMDM4-MCF10A vs siCTL-MCF10A cells (yellow circle) with those resulting from siMDM4-MCF10A+Adr vs siCTL-MCF10A+Adr cells (pink circle). Adriamycin (Adr) 2 μm was administered for 5 h. Red numbers represent upregulated proteins; green numbers represent downregulated proteins; black number in the intersection represents proteins regulated in an opposite manner. Protein hits were filtered to a fold difference larger than 30% (corresponding to a ratio of (+)>1.3 or (−)<0.7) (b) Overlap of proteins resulting from comparison of siMDM4-MCF10A+Adr vs siCTL-MCF10A+Adr (pink circle) with those resulting from siCTL-MCF10A+Adr vs siCTL-MCF10A cells (blue circle). Colour numbers are represented as in a. (c) Overlap of the three groups represented in a and b. Black numbers represent modulated proteins. (d) Fold of change of indicated proteins resulting from comparison of siMDM4-MCF10A+Adr vs siCTL-MCF10A+Adr (pink columns) with those resulting from siCTL-MCF10A+Adr vs siCTL-MCF10A cells (blue columns). Values are in a logarithmic scale. (e and f) P53 networks identified from IPA core analysis. Continued and dotted lines represent respectively direct and indirect interactions. (e) Red and green proteins are respectively significantly upregulated and downregulated by Adr (as resulted from siCTL-MCF10A+Adr vs siCTL-MCF10A). (f) Red and green proteins are upregulated and downregulated by siMDM4 in the presence of Adr (as resulted from siMDM4-MCF10A+Adr vs siCTL-MCF10A+Adr), respectively. Dark colours indicate highly represented proteins. Shapes in the legend indicate different functions of the network proteins.

