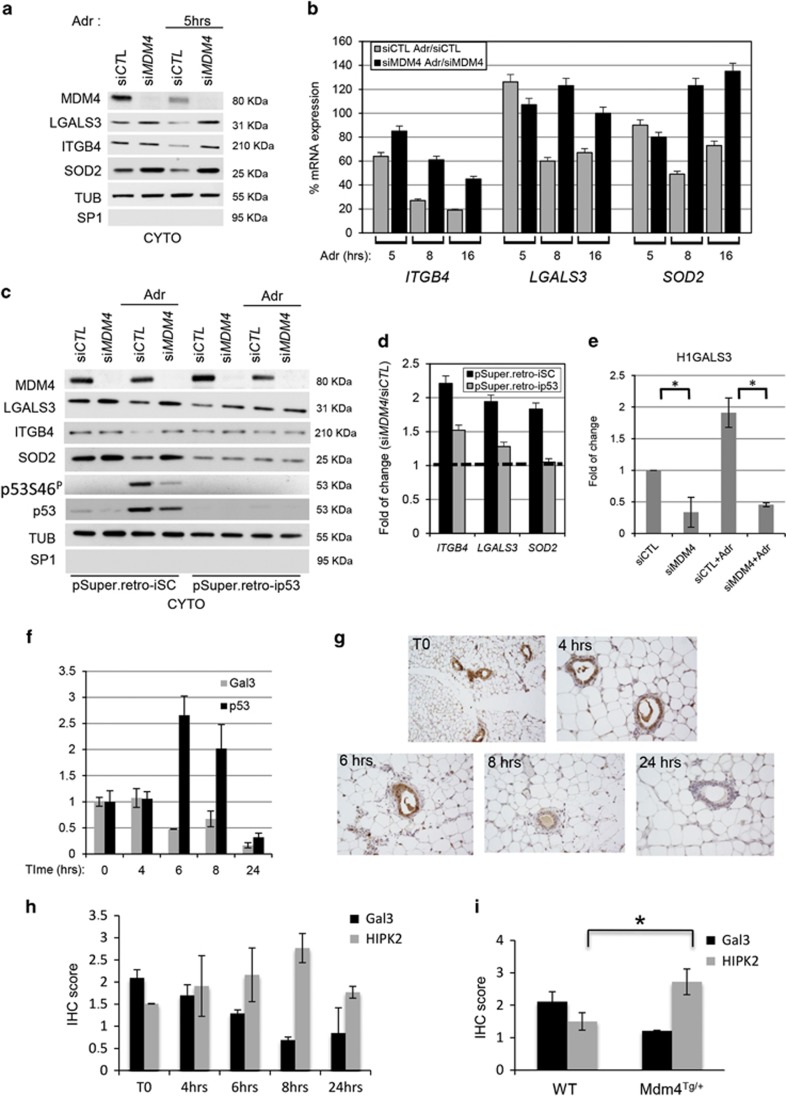
Figure 6.
MDM4 enhances p53-mediated repression of anti-apoptotic proteins. (a) WB of the indicated proteins in cytoplasmic extracts (CYTO) of siMDM4-MCF10A or siCTL-MCF10A cells untreated or treated with 2 μm Adr for the indicated time point. (b) RT–qPCR of mRNA expression of the indicated genes in siCTL-MCF10A (grey columns) and siMDM4-MCF10A cells (black columns) exposed to Adr for the indicated time points. Gene activation was calculated by setting 100% gene expression in untreated cells of each MCF10A population. Mean±s.e.m. of two experiments performed in triplicates are shown. (c) WB of the indicated proteins in CYTO of pSuper.retro-iSCMCF10A and pSuper.retro-ip53MCF10A cells interfered with siCTL or siMDM4 and exposed to 2 μm Adr for 8 h. (d) RT–qPCR of mRNA of the indicated genes in pSuper.retro-iSCMCF10A and pSuper.retro-ip53MCF10A cells exposed to Adr. Gene expression in siMDM4 and siCTL cell populations was normalized to the gene expression in untreated cells. Columns represent the ratio of each normalized gene in pSuper.retro-iSCMCF10A (black columns) and pSuper.retro-ip53MCF10A (grey columns) cells. Dotted line indicates unchanged gene expression. (e) ChIP analysis of p53 binding on LGALS3 promoter in HCT116 cells transfected with siCTL and siMDM4 and treated with 2 μm Adr for 16 h. Mean±s.d. of three experiments are shown (*P=0.05 Student's t-test). (f) Densitometric analysis of WB of indicated proteins in breast tissue isolated at different time points from female mice subjected to total body γ-irradiation (6 Gy). Two animals were sacrificed at each time point. Mean±s.d. from two animals are shown. (g) Immunohistochemistry of mLgals3 expression in mammary fat pad samples of γ-irradiated mice as in f. (h) Immunohistochemistry evaluation of mLgals3 and Hipk2. Immunohistochemistry score was obtained by multiplying the percentage of positive cells by the intensity (staining intensity was scored on a scale of three grades: 1, weak staining; 2, moderate staining; 3, strong) in five ducts/sample. Four mammary fat pad samples/mouse were analysed. Mean±s.d. from two animals are shown. (i) Analysis of mLgals3 and Hipk2 score calculated as in h. Four mammary fat pad samples/mouse were analysed. Mean±s.d. from two control (WT) and two Mdm4-overexpressing transgenic (Mdm4Tg/+) mice are shown (*P=0.05 Student's t-test).

