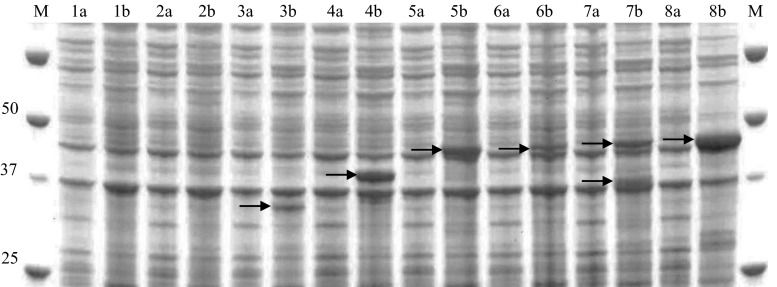
Fig. 4.
SDS-PAGE (10 %) analysis of CrtC expression in E. coli BL21. M precision plus protein standard. The first lane (a) of each sample shows cells before induction with 0.6 mM IPTG, and the second lane (b) shows cells after 4 h of expression at 37 °C. 1 pET15b control, 2 Fos06CrtC (32 kDa), 3 Fos13CrtC (32 kDa), 4 RpCrtC (38 kDa), 5 RrCrtC (44 kDa), 6 BrCrtC (44 kDa), 7 TrCrtC (44 kDa), 8 RgCrtC (44 kDa). The indicated molecular weights are deduced from amino acid sequences. CrtC expression bands are indicated by arrows

