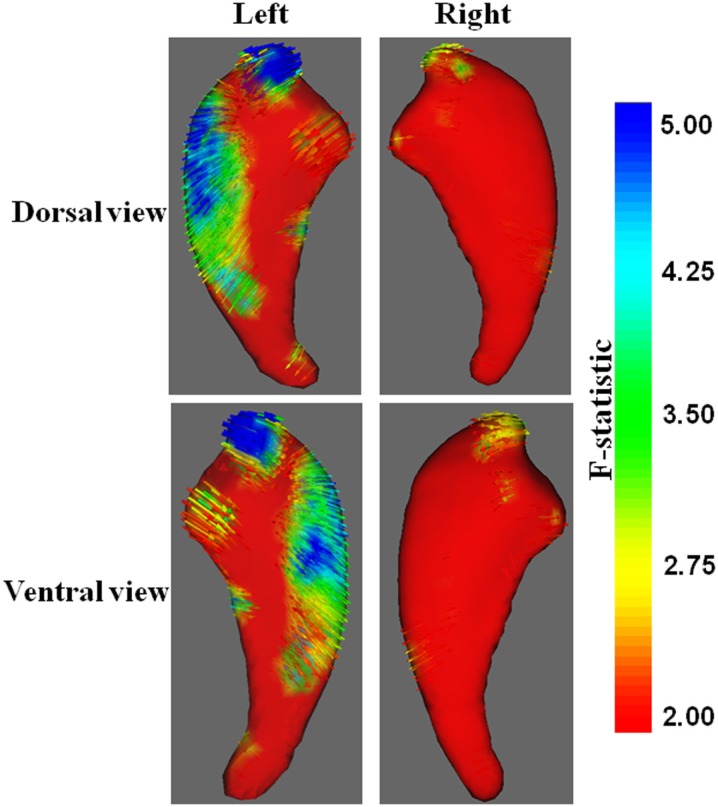
Figure 4.
Vector graphs of the caudate nucleus revealed by traditional vertex analysis. An increase from red to blue indicates a transition from lower to higher statistical significance. Small arrows shown on the surface indicated the direction of the changes. Arrows pointing inward indicated that the volumes of the caudate nucleus in patients with KOA were smaller than that of the control group.

