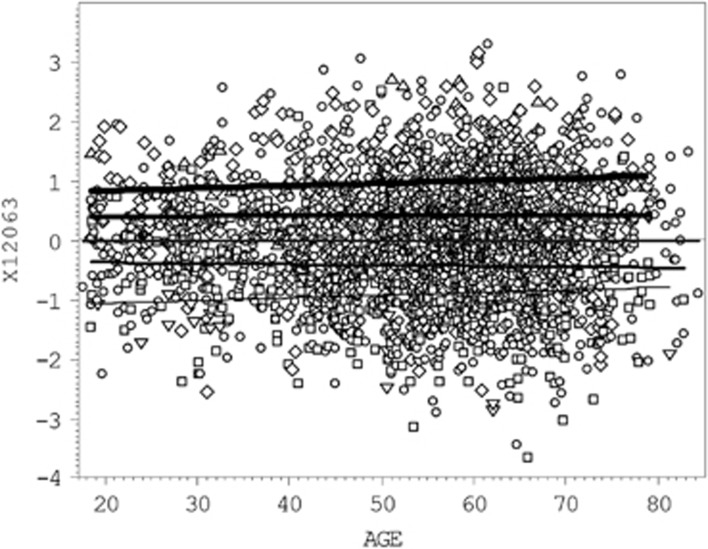
Figure 2.
Multiple scatterplot of X12063 values vs age. Five black regression lines correspond to the X12063 average values in individuals carrying from 0 (the lower thin line) to 4 (upper heavy line) ‘+' alleles in rs4646450-rs4363657 genotype. The regression line corresponded to carries of two ‘+' alleles (double heterozygotes) overlay the population average (the middle line). Comparison of the genotype-specific regression lines gives statistically highly significant difference by LRT (P=2.3E−62) and the ‘+' allele explains 10.52% of the X12063 variation. The ‘+' allele for each of two SNPs is defined in Table 3.

