Fig. 3.
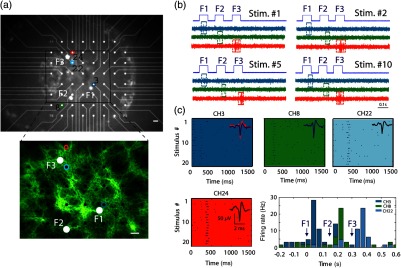
Targeted optogenetic stimulation results. (a) Targeted stimulation loci (F1 to F3, white discs) superposed on bright-field (top panel) and fluorescent (bottom panel) images of ChR2-expressing cells grown on a multielectrode array. The responsive electrodes (channels 3, 8, 22, and 24) are marked with colored circles. Scale bar: . (b) Raw electrophysiological traces recorded on the responsive channels (3, 8, and 24) during representative stimulus repetitions, demonstrating selective stimulation of the cells in the near vicinity of the selected fibers. (c) Raster and peristimulus time histogram (PSTH) graphs for the responsive electrodes marked in (a) channels 3, 8, 22, and 24, the latter omitted from the PSTH. Insets: average spike waveforms of the induced responses.

