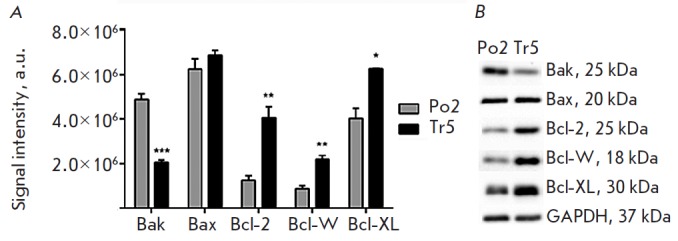
Fig. 2.

Quantitative analysis of pro- and anti-apoptotic proteins in the Po2 cell culture derived from a healthy donor and in the Tr5 culture derived from a PD patient carrying PARK2 mutations (Western blotting). A – signal intensity (arbitrary units) of Bak, Bax, Bcl-2, Bcl-W, and Bcl-XL bands (n = 3).p < 0.001 (***), p < 0.01 (**), and p < 0.05 (*) for comparison of Po2 and Tr5 cultures. B – representative pictures of Western blotbands
