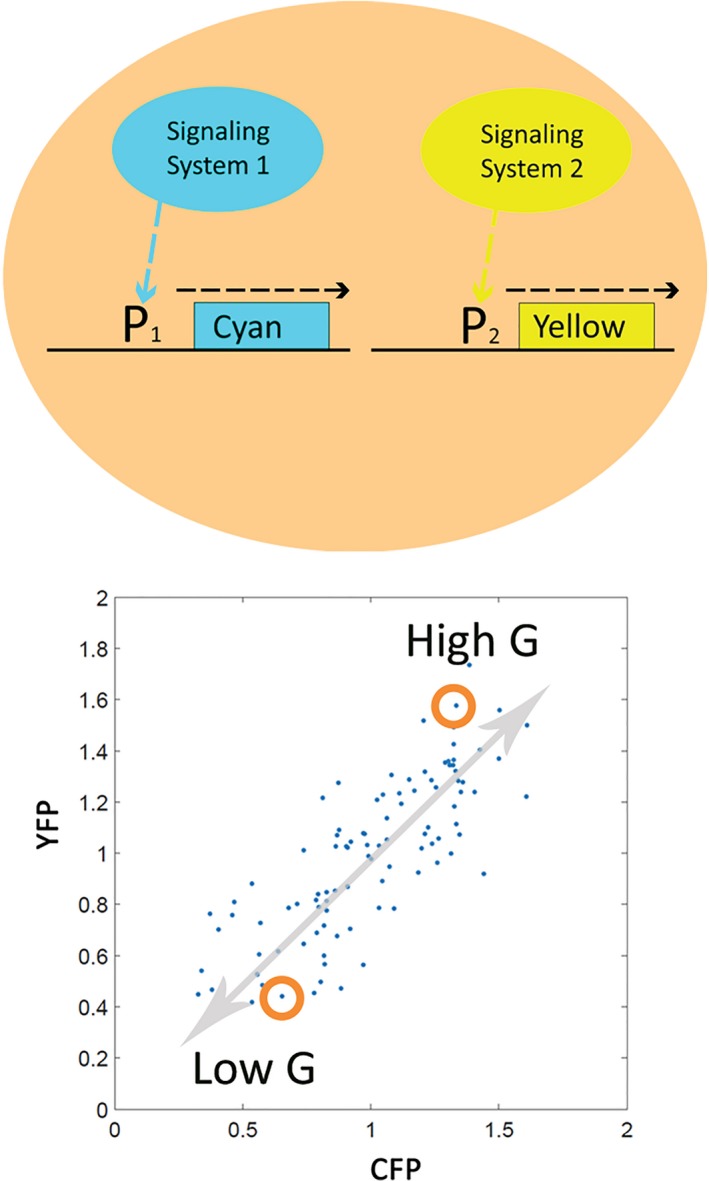
Figure 2.

Quantification of a single‐cell physiological variable, G, in Saccharomyces cerevisiae. Top Panel. A cell containing two reporter genes after (Colman‐Lerner et al., 2005). Signaling System 1 activates Promoter 1, P1, which directs synthesis of a cyan fluorescent protein. An unrelated system, Signaling System 2, activates an unrelated promoter, Promoter 2, which directs the synthesis of yellow fluorescent protein. Bottom Panel. Correlated output of the reporter genes in a population of isogenic single cells (Colman‐Lerner et al., 2005). Each dot shows YFP and CFP signal from a single cell, quantified by careful light microscopy (Gordon et al., 2007; Bush et al., 2012). Gray arrow shows correlation line. Correlated variation defines a new single‐cell physiological variable, G, a measure of the general ability of each cell to express genes into proteins. Cells with higher correlated expression have higher G. Red circles show two cells, one with low G, one with high G. Cell states defined by this variable persist over many hours. Consequences of a high G state include heightened expression of all measured genes, and a more rapid increase in cell volume (Colman‐Lerner et al., 2005).
