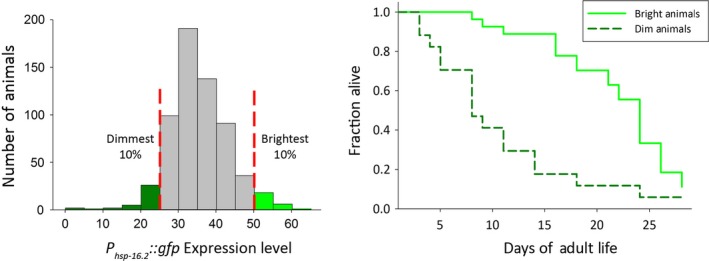
Figure 3.

Interindividual differences in gene expression in isogenic populations of C. elegans and differences in lifespan predicted by differences in gene expression. Data replotted from (Mendenhall et al., 2012). Left Panel. Distribution of values of reporter expression among animals in the population. Vertical bars show brightest and dimmest 10% of animals. Right Panel. Animals in the highest range of values for gene expression (solid bright green line) live longer than those in the lowest range (dashed darker green line). Therefore, in this example, both high and low ranges of values of the physiological variable, P hsp‐16.2 ‐GFP‐signal, operationally define distinct and consequential whole‐organism physiological states.
