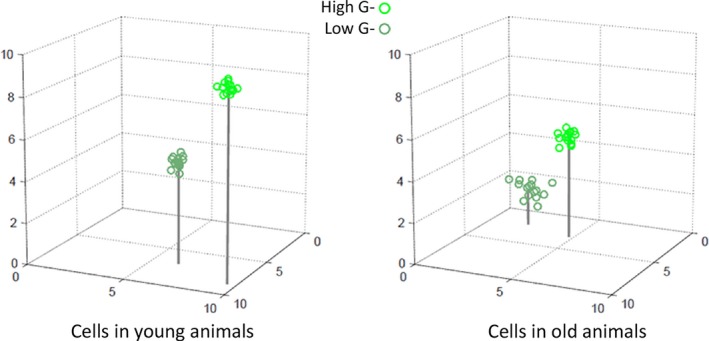
Figure 5.

Hypothetical single‐cell trajectories in a three‐dimensional state space during aging. Figure shows values for three physiological variables in a particular cell in young and old Caenorhabditis elegans. Young animals and old animals are in two groups collected by sorting as in Fig. 3: long‐lived, bright, high G and short‐lived, dim, low G. In this example, values for all three variables were lower in older animals. Moreover, cell‐to‐cell variation in the measured variables was higher in older animals, with the highest variation in the dim, low G group. In practice, future experiments will likely measure more than three variables per cell and statements about the trajectories defined by changes in values will be based not on inspection of plots but on computed changes in position in the appropriate high‐dimensional space.
