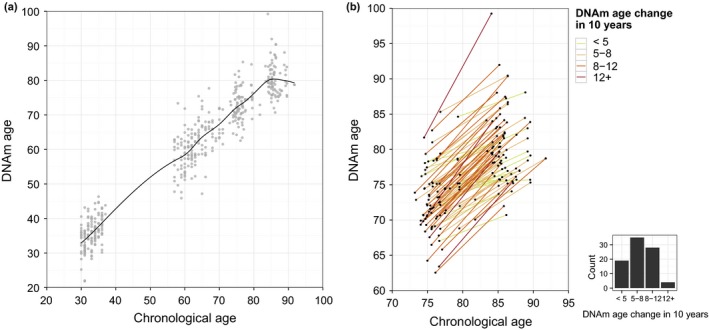
Figure 1.

Horvath DNAm age against chronological age. (a) Correlation between the methylation age using the Horvath model. The relation is visualized by a smoothing spline. (b) DNAm age trajectories of each individual in the longitudinal study of oldest‐olds. The lines are colored by intervals of slow to fast agers, and the histogram indicates the distribution within the intervals.
