
Figure 3.
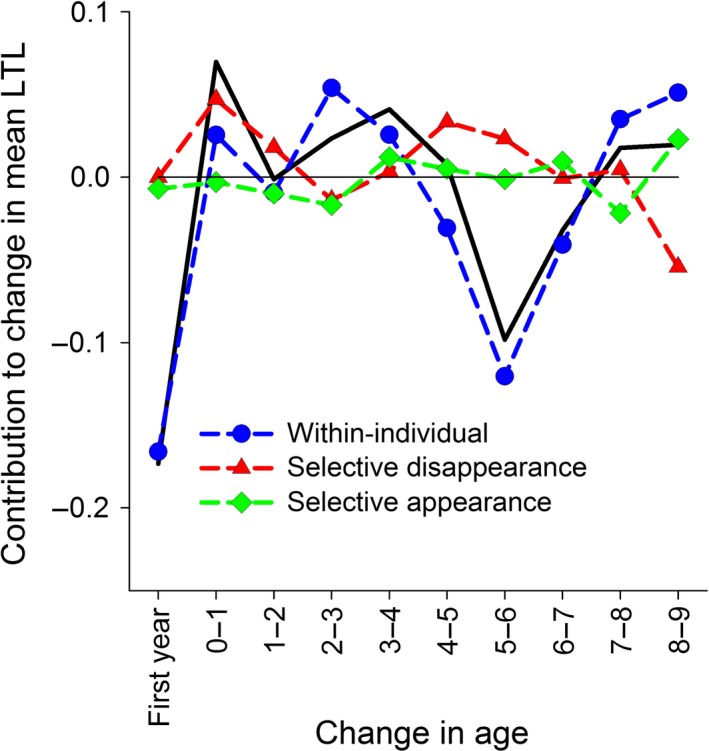
Decomposition of the change in mean relative leukocyte telomere length (RLTL) across age groups into within‐individual and selective components. The black line tracks the absolute difference in mean RLTL across age groups: ‘First year’ denotes change across neonatal and August measures as lamb, ‘0–1’ across August measures as lamb and 1 year old, etc. The other symbols show the contributions of different processes to that difference: Blue circles are within‐individual change, red triangles are selective disappearance effects, green diamonds are selective appearance effects.