Figure 4.

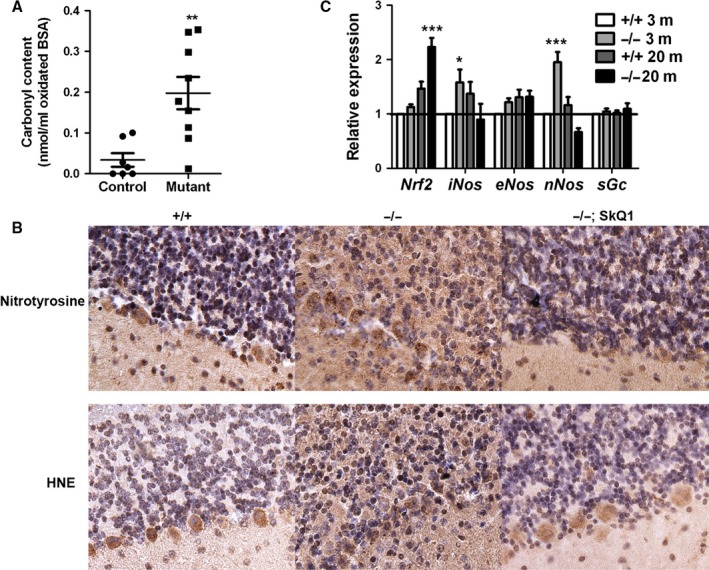
Increased oxidative stress in old mutant mice. (A) Serum carbonyl content. Each point indicates one mouse. **Indicates P < 0.01 by t‐test. (B) Immunohistochemical detection of HNE and tyrosine nitration modification of proteins in old mutant mice. All sections for the same antibody were put on the same glass slide for immunostaining. Negative controls without primary antibodies were all negative for DAB staining. In images, the granular layer is at the top and the molecular layer at the bottom. The nuclei were counterstained by hematoxylin (purple). (C) qRT–PCR analysis of cerebellar gene expression. Four animals were analyzed for each group. * and *** indicate P < 0.05 and P < 0.0001 by Bonferroni post hoc tests following ANOVA. For all panels, means ± SEM are shown.
