Figure 5.

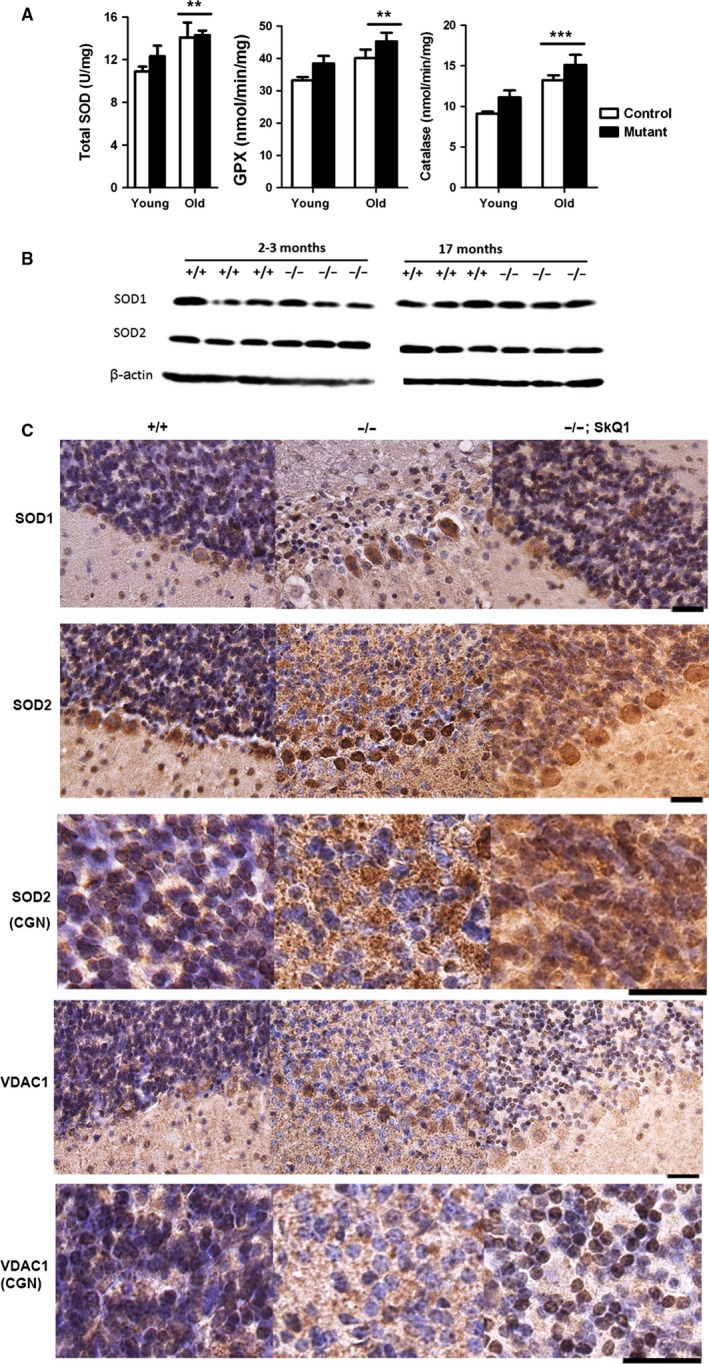
Comparison of antioxidant enzymes and mitochondrial marker VDAC1. (A) Total SOD, glutathione peroxidase, and catalase activity in cerebellar lysates. Young mice were 2–8 months, and old mice were 17–25 months. N for young +/+, young −/−, old +/+ and old −/− were 10, 7, 3, and 8, respectively. ** and *** indicate P < 0.01 and 0.0001 by Bonferroni post hoc tests following ANOVA. (B) Comparison of SOD1 and SOD2 expression in cerebella by Western blotting. (C) Comparison of SOD1, SOD2, and VDAC1 expression in cerebella by immunohistochemistry. All tissues were from 21‐month‐old mice. The nuclei were counterstained by hematoxylin (purple). In images, the granular layer is at the top and the molecular layer at the bottom. Scale bars: 20 μm.
