
Figure 5.
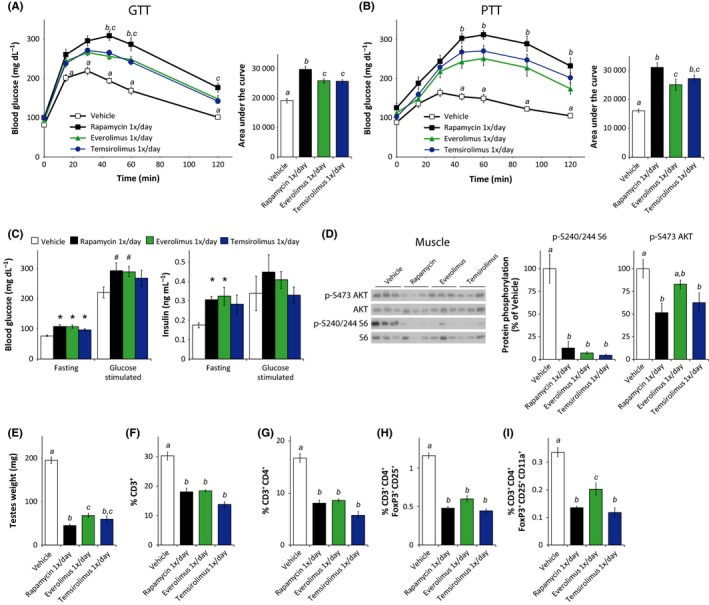
Rapamycin analogs efficiently inhibit mTORC1 but show a reduced impact on glucose homeostasis and the immune system. (A) Glucose and (B) pyruvate tolerance tests on male C57BL/6J mice treated with vehicle or with 2 mg/kg rapamycin (1×/day) or equimolar amounts of everolimus or temsirolimus for 2 or 3 weeks, respectively [n = 9 per treatment; for GTT/PTT, Tukey–Kramer test following two‐way repeated‐measures anova, a = P < 0.05 vehicle vs. all groups, b = P < 0.05 rapamycin vs. everolimus, c = P < 0.05 rapamycin vs. temsirolimus. For AUC, means with the same letter are not significantly different from each other (Tukey–Kramer test following one‐way anova, P < 0.05)]. (C) Fasting and glucose‐stimulated insulin secretion (GSIS) were measured by fasting mice treated for 5 weeks overnight, collecting serum, injecting 1 g/kg glucose, and collecting serum 15 min after injection. [n = 9/group (glucose), 4/group (insulin), # P ≤ 0.08 vs. vehicle, *P ≤ 0.05 vs. vehicle, Dunnett's test following one‐way anova)]. (D) Muscle lysate was analyzed by Western blotting and the phosphorylation of S6 240/244 and AKT S473 relative to their respective total protein was quantified [n = 5–6 per treatment; means with the same letter are not significantly different from each other (Tukey–Kramer test following one‐way anova, P < 0.05)]. (E) The testes of mice in each treatment group were weighed [n = 9/group, means with the same letter are not significantly different from each other (Tukey–Kramer test following one‐way anova, P < 0.05)]. (F–I) Flow cytometry analysis (expressed as percent of total live cells) on splenocytes isolated from each treatment group [n = 3–8 mice/group, means with the same letter are not significantly different from each other (Tukey–Kramer test following one‐way anova, P < 0.05)]. The experiments presented here were conducted in parallel with the experiment presented in Figs 2, 3, 4, and the vehicle and daily (rapamycin 1×/day) data are duplicated here for ease of comparison. Error bars represent standard error.