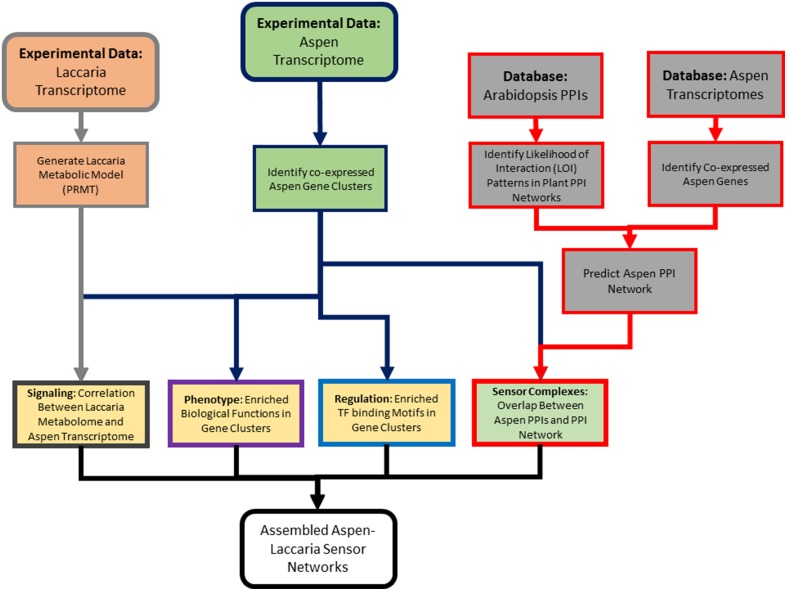
Figure 2.
Outline of analysis pipeline. This high-level diagram outlines the multi-omics data used in analysis, what individual analysis methods were applied, and how those multi-omic data types were integrated. Box border colors reference the colors used for identifying components if sensor mechanisms from Figure 1.

