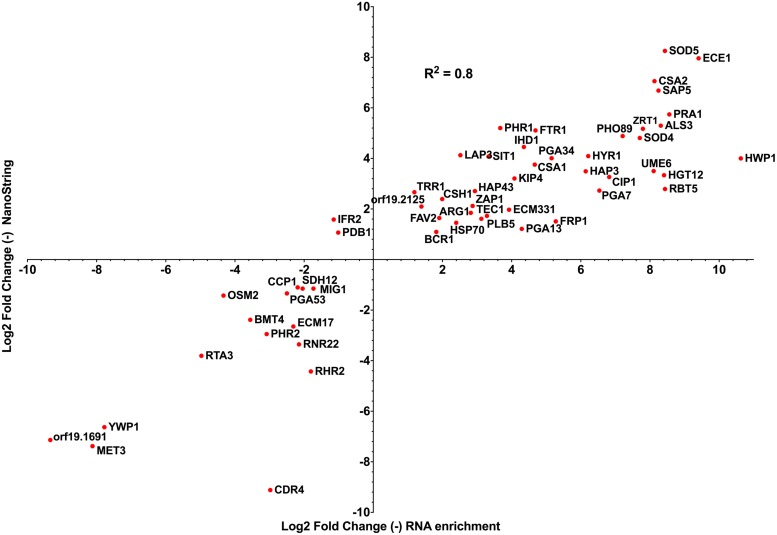
FIGURE 3.
Correlations between log2 fold change data generated by nanoString and enrichment/RNA-seq approaches (Amorim-Vaz et al., 2015b; Xu et al., 2015), taking early gene expression patterns from both studies (nanoString: mouse kidneys 12 h post infection versus in vitro stationary-phase culture; enrichment/RNA-seq: mouse kidneys 16 h post infection versus in vitro exponential-phase culture). The total number of genes regulated at early time points in Xu et al. (2015) and Amorim-Vaz et al. (2015b) was 148 and 1114, respectively. R2: R squared Pearson correlation coefficient, calculated with Prism 6.0.

