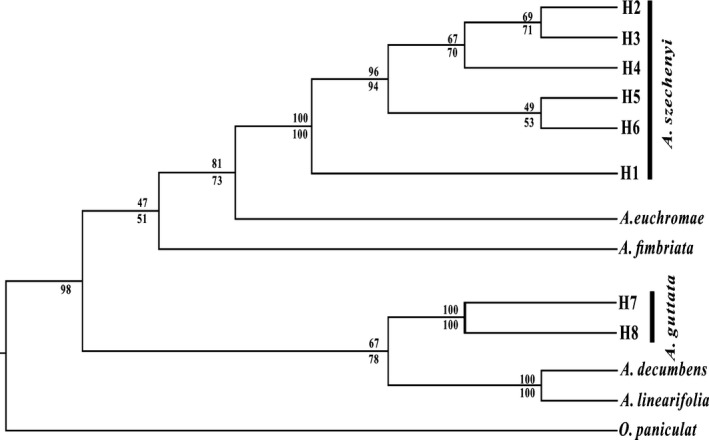
Figure 2.

Phylogenetic trees reconstructed using the maximum likelihood method based on the nrDNA ITS matrix including extra sequences from additional individuals. Bootstrap support values from the ML analyses are shown below the branches and values from MP analyses above the branches.
