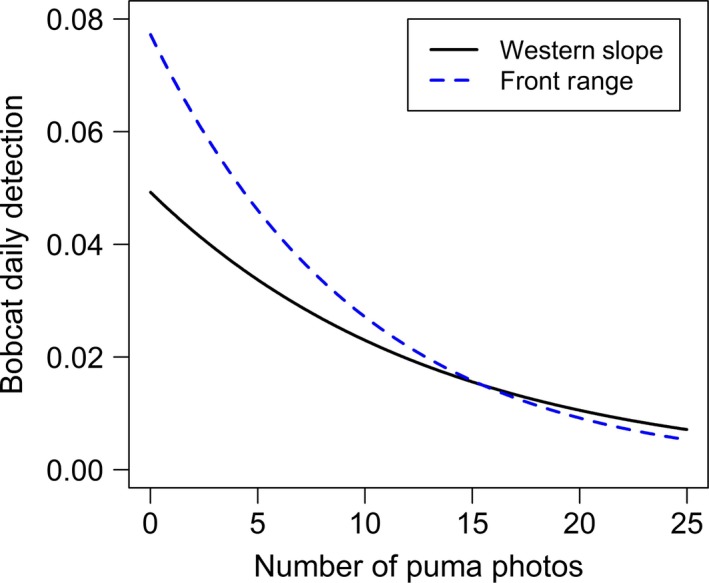
Figure 6.

The effect of pumas on daily detection probability of bobcats varied by puma use at a site. Bobcat detection probability decreased with the number of puma photographs at a camera location (i.e., puma count) on the Western Slope (WS) and Front Range (FR) of Colorado. Parameter estimates from the top models (Tables 5 and 6) were used to plot the relationship for puma count, human development (mean value), grid 1, puma lag effect (=0), and puma lag effect interaction (=0). Our data for the number of puma photographs at a site ranged from 0–8 images over 113 days on the WS and from 0–6 images over 92 days on the FR. Results are extrapolated to visualize the predicted response of bobcat detection probability in relation to higher frequencies of puma detections at a site.
