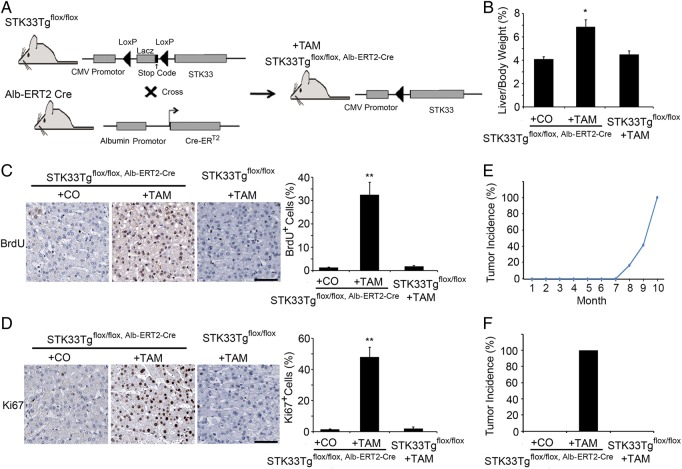
Figure 3.
Increased cell proliferation and tumour generation after STK33 overexpression in mice liver. (A) Scheme of STK33 overexpression using STK33Tgflox/flox, Alb-ERT2-Cre mice. (B) Liver weight to body weight ratios. (C, D) Immunohistochemical analysis for BrdU (C) and Ki67 (D) shows the differences in hepatocyte proliferation between STK33Tgflox/flox, Alb-ERT2-Cre mice treated with either tamoxifen (TAM) or corn oil and wild-type littermate control mice treated with TAM. Quantification of BrdU- and Ki67-positive cells is on the right. (E) Time/dose curve for incidence of visible tumours in STK33Tgflox/flox, Alb-ERT2-Cre mice treated with TAM. Tumours were first found 8 months after TAM treatment. (F) Incidence of visible tumours in STK33Tgflox/flox, Alb-ERT2-Cre mice treated with either corn oil or TAM and STK33 floxed littermate control mice treated with TAM. Mice were killed 10 months after TAM treatment. The data shown are the mean of three independent experiments. n=10 mice/group for (B)–(E). Bar=50 μm. Error bar represents ±SD. *p<0.05, **p<0.01.

