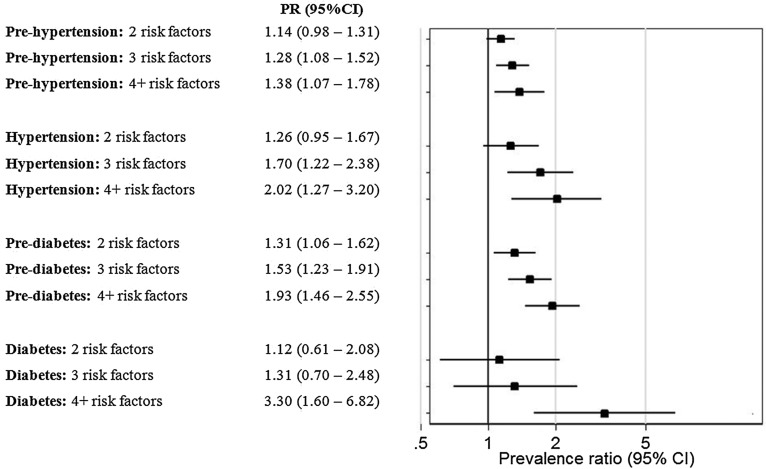
Figure 1.
Forest plot of the association between outcomes of interest and number of modifiable risk factors. Participants aware of hypertension or diabetes diagnosis were excluded from the analysis accordingly. *Prevalence ratios (PR) were adjusted by sex, age, education level and socioeconomic status. Study site was included in the model as cluster with robust SEs.

