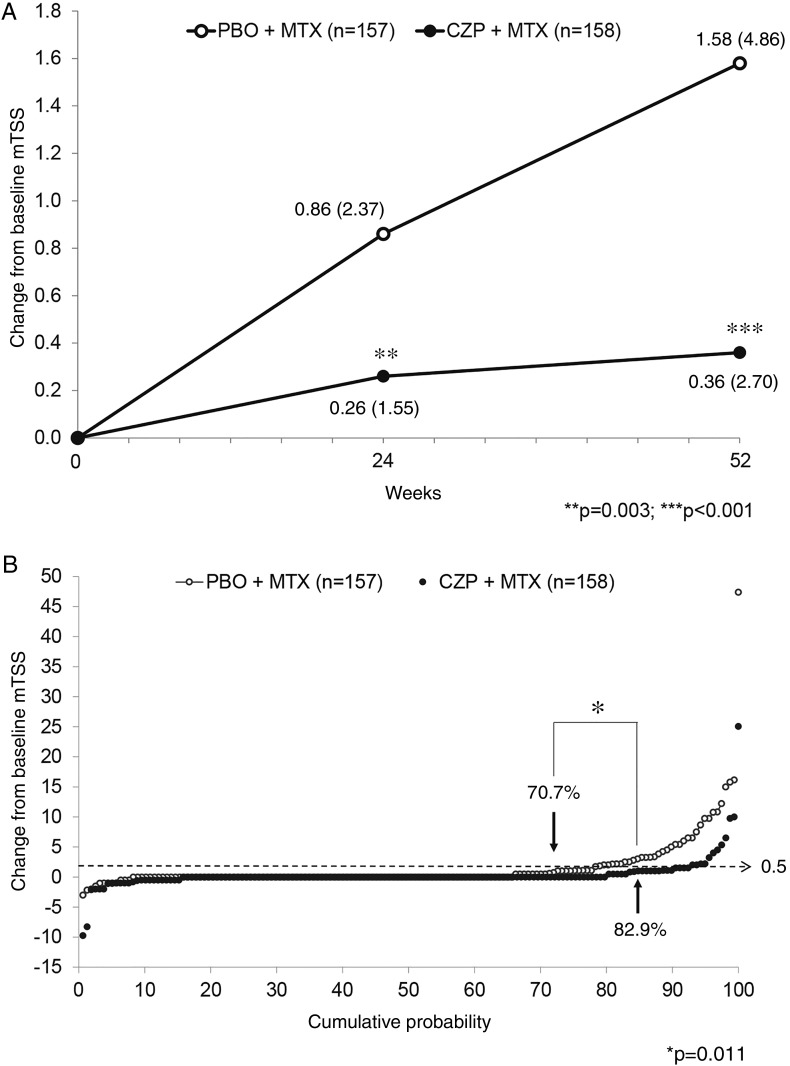
Figure 2.
(A) Change from baseline in modified Total Sharp Score (mTSS CFB) at weeks 24 and 52. For calculation of p values, an ANCOVA model was used for mTSS CFB by converting measured values to rank scores and using treatment group as a factor and baseline rank score as a covariate. Values in the figure indicate mean (SD) at each time point and treatment group. (B) Cumulative probability plot of mTSS CFB at week 52. Percentages in the figure indicate non-progression (mTSS CFB ≤0.5) rates of each treatment group. P value is calculated by Fisher's exact test. The mTSS data used in (A) and (B) are all imputed using linear extrapolation (LINEAR) for FAS. The number of patients in the CZP+MTX group is 158 despite the FAS reported as 159 because one patient in the group had no mTSS data after treatment. CZP, certolizumab pegol; MTX, methotrexate; mTSS, modified total Sharp score; PBO, placebo.

