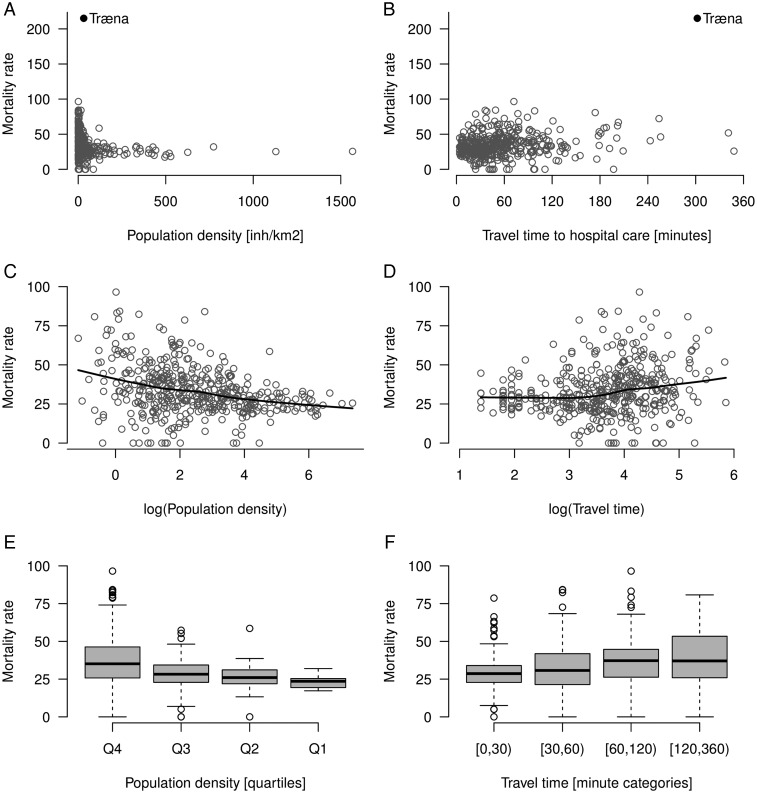
Figure 1.
Bivariate associations between mortality rates in 434 Norwegian municipalities and population density and transportation to hospital care. Scatterplot of raw data (A and B); log data with lowess line superimposed (C and D); categorized predictors according to quartiles and predefined categories (E and F). In figures C–F the outlier Træna has been removed. In the accompanying statistical analyses data were weighted with respect to municipality population.

