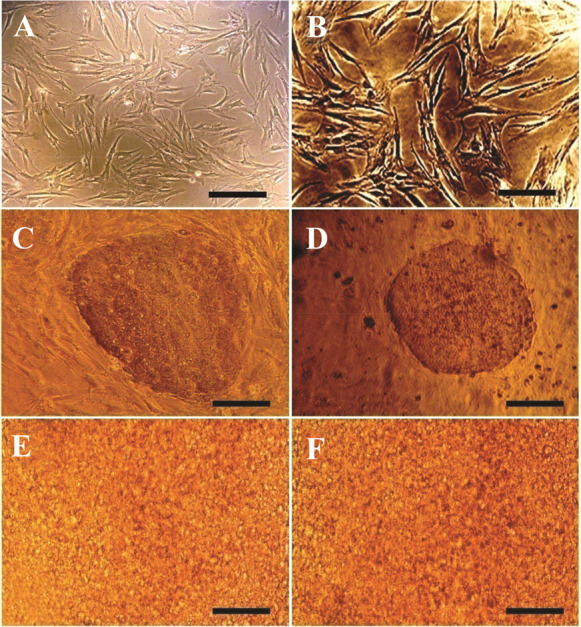
Figure 1.

Phase contrast microscopy images of A) MEFs (Scale bar= 200 μm); B) hMSCs (Scale bar=100 μm); C) hiPSC colones on MEFs feeder (Scale bar=200 μm); D) hiPSC colonies on hMSCs feeder (Scale bar=200 μm); E) differentiated hiPSCs using protocol 3 and MEFs feeder (Scale bar=800 μm); F) differentiated hiPSCs using protocol 5 and hMSCs feeder (Scale bar=800 μm).
