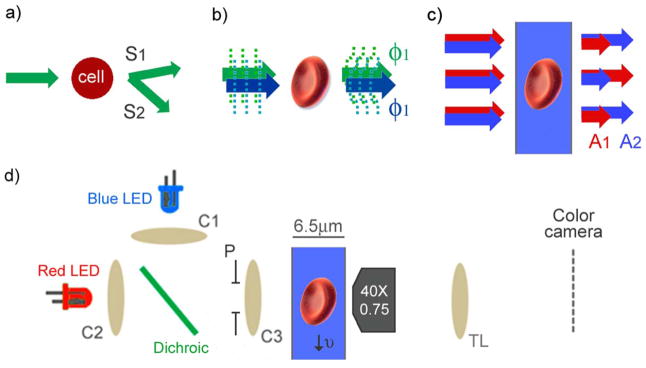
Figure 1.
Comparison of optical measurement methods of red blood cell indices. (a) Clinical hematology analyzers quantify optical scattering at different angular intervals, S1 and S2. (b) Phase imaging quantifies optical phase shift of transmitted light, ϕ1 and ϕ2, at two different colors. (c) Quantitative absorption cytometry (QAC) measures transmitted light, A1 and A2, through cells immersed in an absorbing buffer at two different colors. (d) QAC uses two LEDs collimated by condenser lenses (C1, C2) and focused into the channel using C3. The condenser aperture (P) is set so that the illumination numerical aperture is 0.4. Cells travel through the microfluidic channel and are imaged onto a color camera using a microscope objective and tube lens (TL). [Color figure can be viewed in the online issue, which is available at wileyonlinelibrary.com.]

