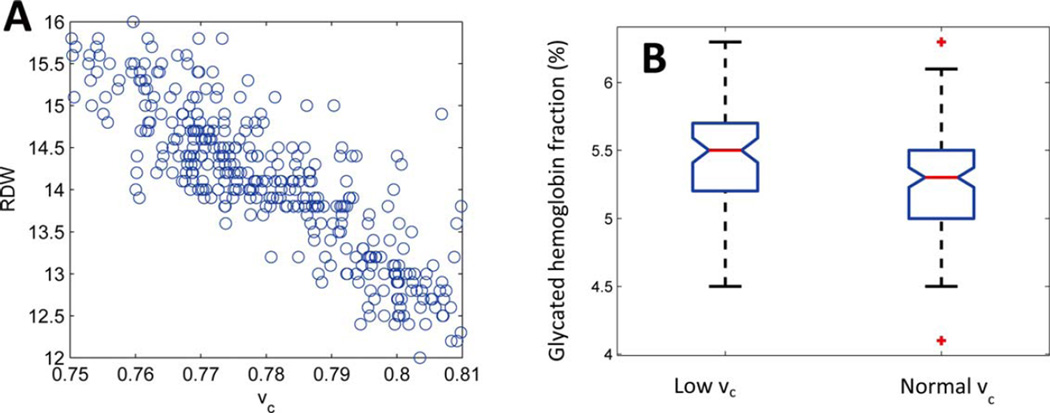
Figure 3.
RDW and glycated hemoglobin depend on vc. Panel A shows RDW and vc for 450 randomly selected patients with CBCs at Massachusetts General Hospital. See “Correlation Cohort” in Methods. The correlation coefficient (ρ) is −0.91. Panel B shows boxplots of glycated hemoglobin for 74 non-diabetic individuals with vc < 0.775 (median vc = 0.77) and 115 individuals with vc > 0.79 (median vc = 0.80). See “A1c Cohort” in Methods for more detail. The red horizontal lines show the medians of each group (5.5% and 5.3%). These medians are different according to a Kruskall–Wallis test with P < 0.002. The low vc group had a median RDW of 14.6%, and the high vc group had a median RDW of 12.9%. The notches show the 95% confidence intervals for the medians. The boxes extend from the 25th to the 75th percentile for each group.

