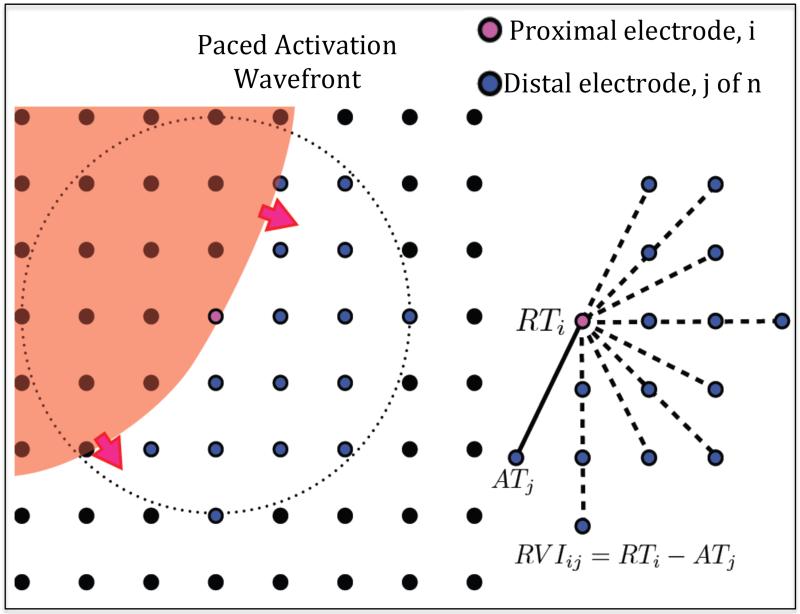
Figure 2. RVI mapping.
Left - Activation wave (red) shown propagating through region of a recording electrode grid (black circles), with the current proximal recording electrode shown in pink. All downstream distal electrodes within a set radius are shown in blue. Right - RVIij is calculated as the difference between the repolarization time of the ith proximal electrode (RTi) and the activation time of each jth distal electrode (ATj) on the S2 beat.

