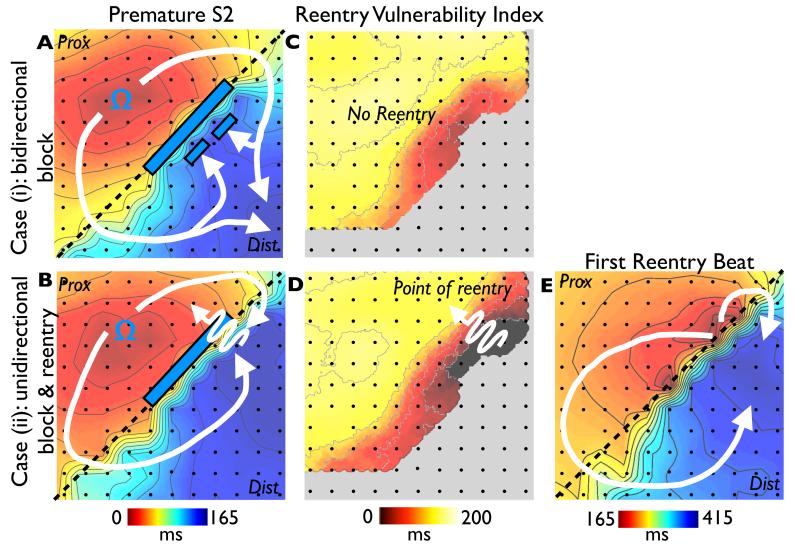
Figure 4. Animal experiments.
Activation sequence after premature stimulation (S2) from an experiment in a Langendorff pig heart model of inhomogeneous repolarization (APD shortened by Pinacidil above the dashed line and prolonged by sotalol below the dashed line) in the cases of unsuccessful (A) and successful (B) re-entry. The premature wavefront propagates from the stimulation site (Ω) and is recorded by the electrode grid (electrodes represented by dots). C & D show RVI corresponding maps, with the critical area of low RVI identified in D. E shows activation sequence of the first re-entrant beat.

